
Different questions drive different systems
OLTP supports short business transactions such as placing an order or updating inventory. OLAP supports analytical questions across many records, such as revenue by region over a year. These describe workload shapes, not a rule that one product can only do one thing. AWS's comparison provides the foundational distinction.
A checkout request might read one account, update a stock row and insert an order. A revenue report might scan millions of order lines, join dimensions and aggregate by month. Both use SQL, but they compete for different resources.
Compare the requirements
| Dimension | Transactional workload | Analytical workload |
|---|---|---|
| Main goal | Correct state changes | Useful aggregate answers |
| Typical access | Small indexed reads and writes | Large scans and aggregations |
| Freshness | Immediate business state | Defined ingestion delay |
| Design pressure | Constraints and concurrency | Scan efficiency and data history |
The table is a workload model, not a benchmark. A small reporting query on a transactional database may be perfectly sensible. Separation becomes useful when report scans consume the headroom needed for checkout latency.
An order database becomes a reporting engine
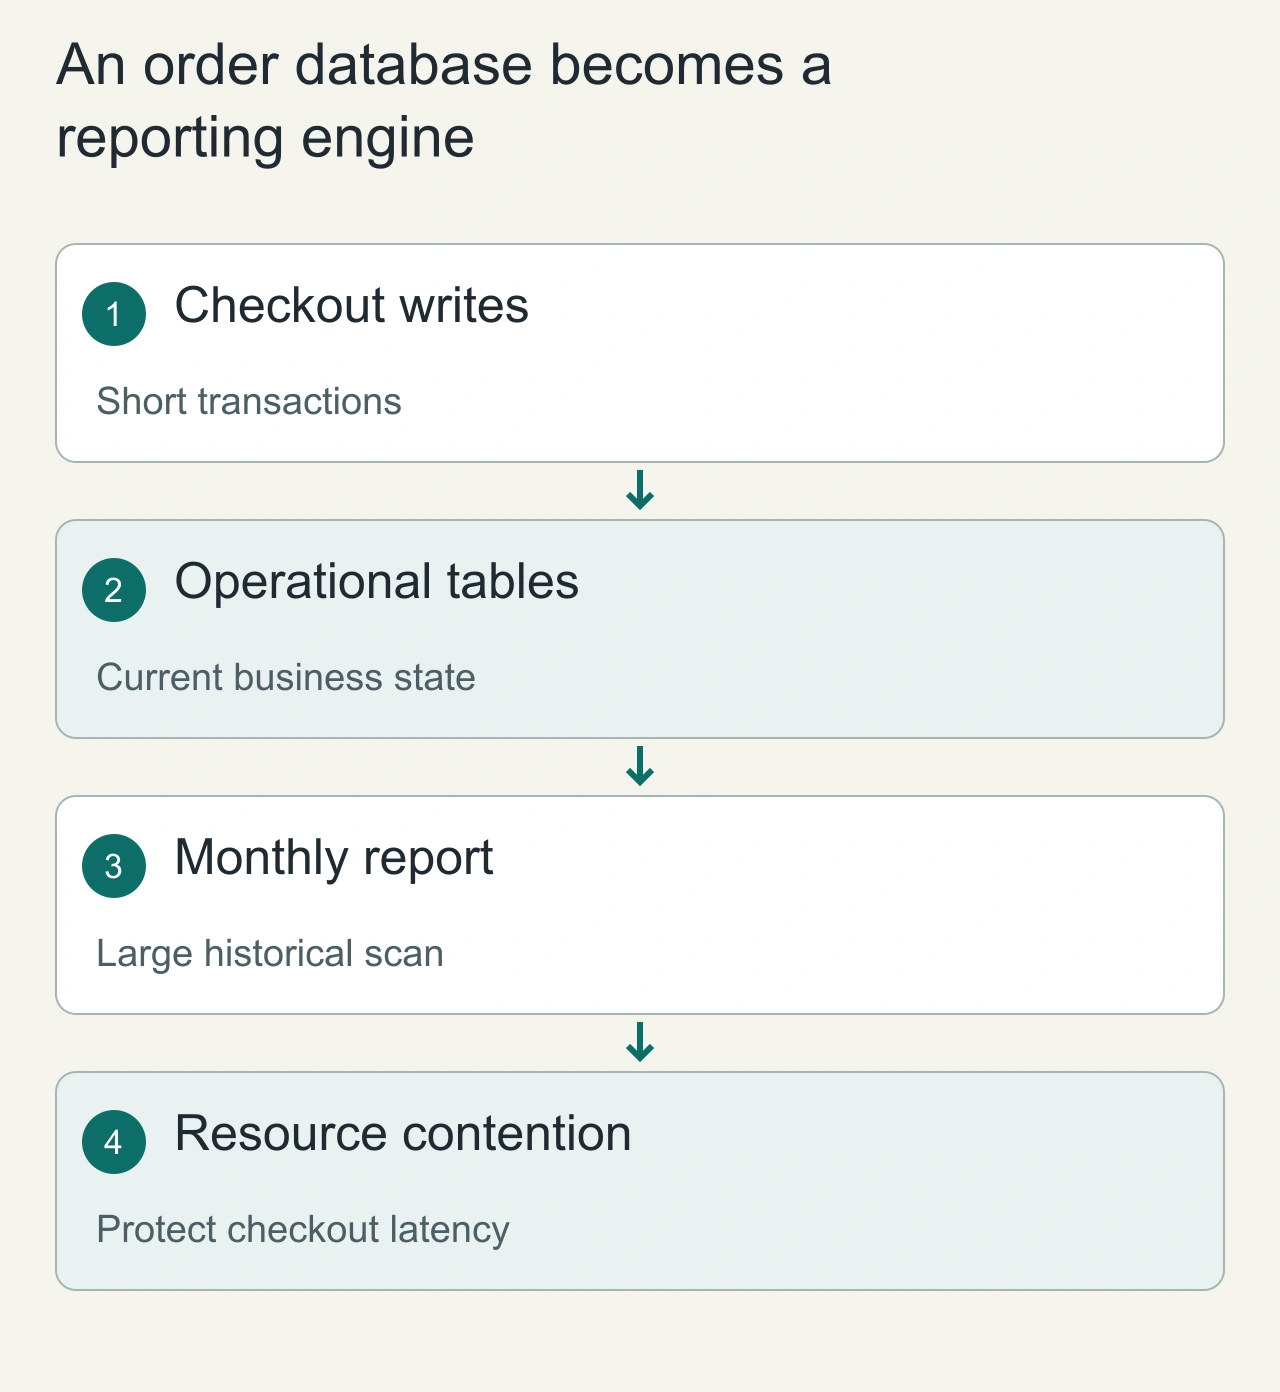
Suppose an online shop stores orders, customers and stock in a transactional database. Checkout reads a few rows, reserves stock and records an order. A finance report asks for twelve months of revenue grouped by product category and region. Although both requests use SQL, they touch very different amounts of data and have different latency requirements. The report can be correct while still consuming enough CPU, I/O or temporary space to delay checkout.
Start by observing the actual query plans and workload overlap rather than assuming that the database brand determines its role. An index may improve a selective report, but it cannot turn every broad aggregation into a small lookup. A reporting replica can isolate some read pressure while introducing replication lag and separate capacity costs. A warehouse or analytical store can serve larger historical questions with a different data layout. The deciding requirement is whether the business needs a live transactional answer, a reproducible historical report, or an exploratory scan across many dimensions.
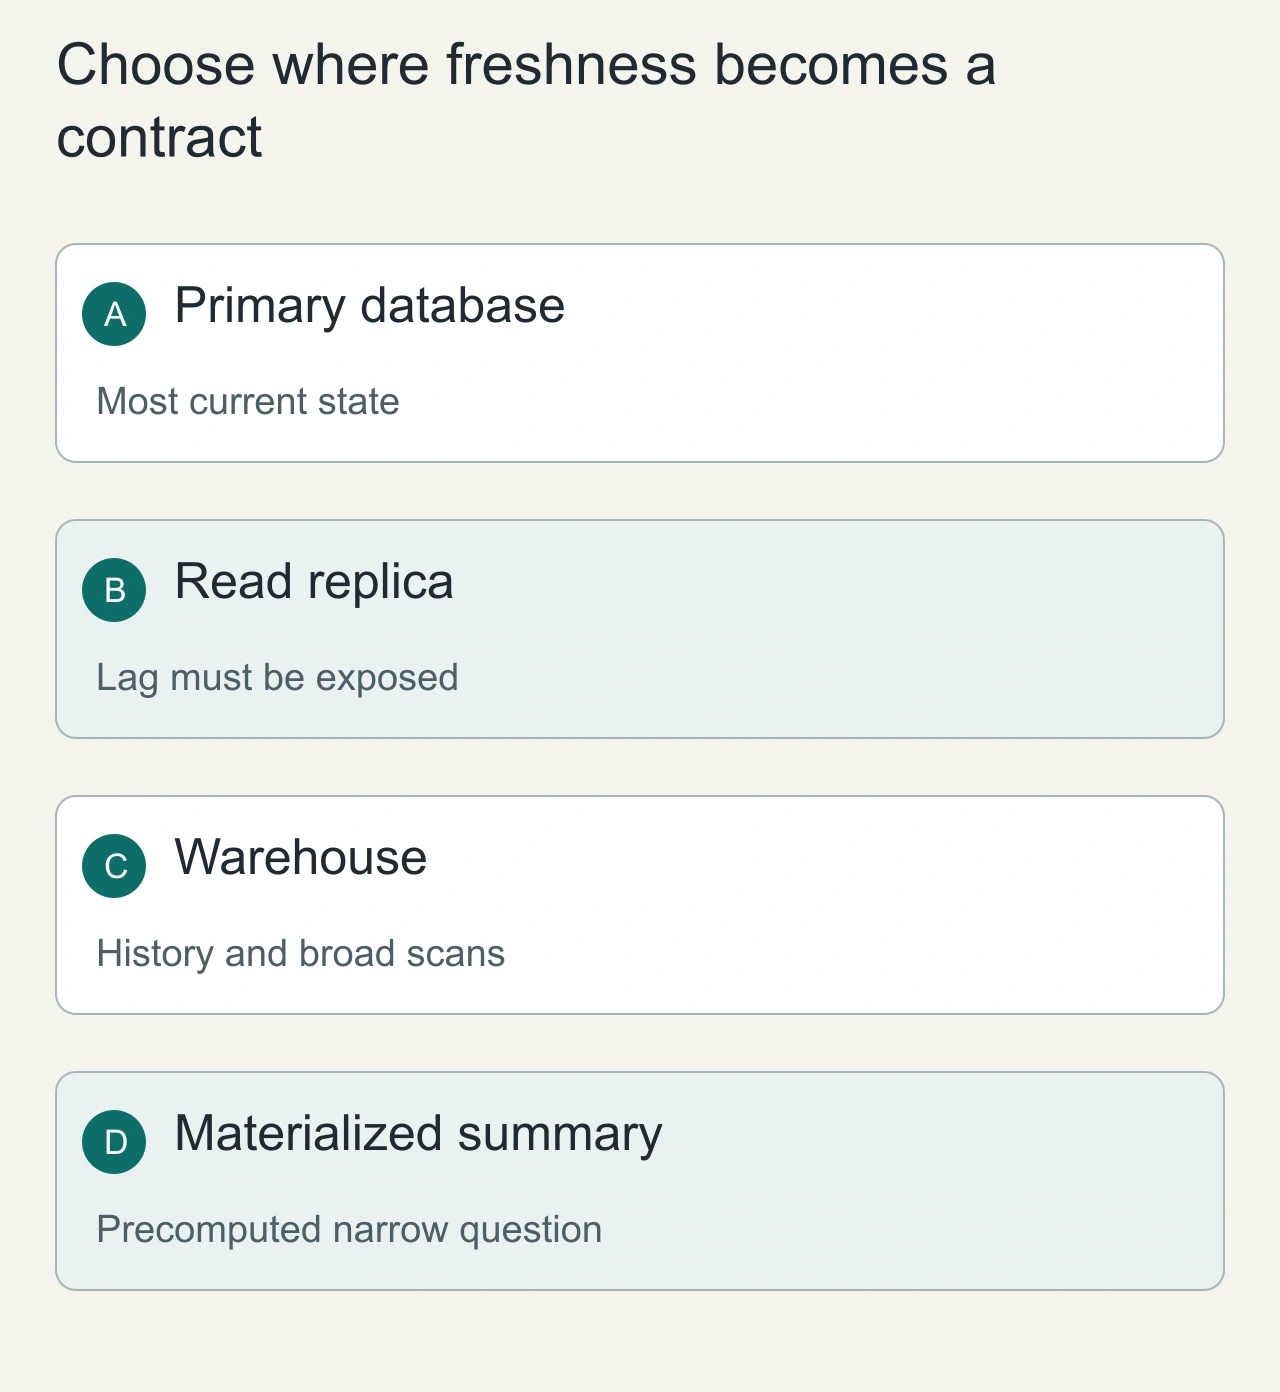
Choose where freshness becomes a contract
Use the operational database for decisions whose correctness depends on current transactional state, such as whether an item can be reserved. For a customer-facing order status, a replica may be acceptable only if the product explains or tolerates the replication delay. For a weekly management dashboard, a documented batch boundary can be more useful than an apparently live number that changes while someone exports it. Freshness is part of the answer, not an invisible infrastructure detail.
When moving data to analytics, carry event time, ingestion time and stable business identifiers separately. A late refund should update the correct reporting period even if it arrives in today's pipeline run. Decide how deletions, corrections and schema changes propagate before the first executive dashboard becomes a dependency. Aggregated summaries can provide predictable reads for a fixed question, but they need a clear rebuild procedure when definitions change. Keep metric definitions close to the transformation that implements them; two dashboards with different revenue rules can disagree even when both stores are functioning correctly.
An example architecture
Orders database → change capture or scheduled export → analytical tables → dashboards. Define the meaning of each timestamp: order creation, business completion and warehouse arrival are different events. A report labelled today can be misleading if it excludes delayed ingestion or uses a different timezone from the application.
A reporting model might keep one fact row per order line plus product, customer and calendar dimensions. Decide how corrections and refunds appear: modifying a past row and appending a correction event produce different historical behavior. Choose a policy before publishing revenue metrics.
Avoid a premature split
Begin with indexed reporting queries and explicit time windows if the dataset is small. Measure runtime, scanned rows, connection pressure and the effect on user-facing latency. A replica can isolate some reads, but replica lag means it is not interchangeable with the primary for read-after-write workflows.
When a separate analytical system is justified, budget for ingestion monitoring, schema evolution, duplicate events and backfills. Data copies create operational work. A fast dashboard with an incorrect join is less useful than a slower correct report.
Validate the business meaning
Use a small fixture containing a completed order, cancellation, refund, late event and timezone boundary. Reconcile the report against a manually calculated result. Then measure larger workloads separately. Record the freshness target and display the last successful ingestion time.
For choosing the underlying store, continue with How to choose a database. Use AiFolder interviews to explain how the workload changes your architecture.
Investigate a slow report without risking orders
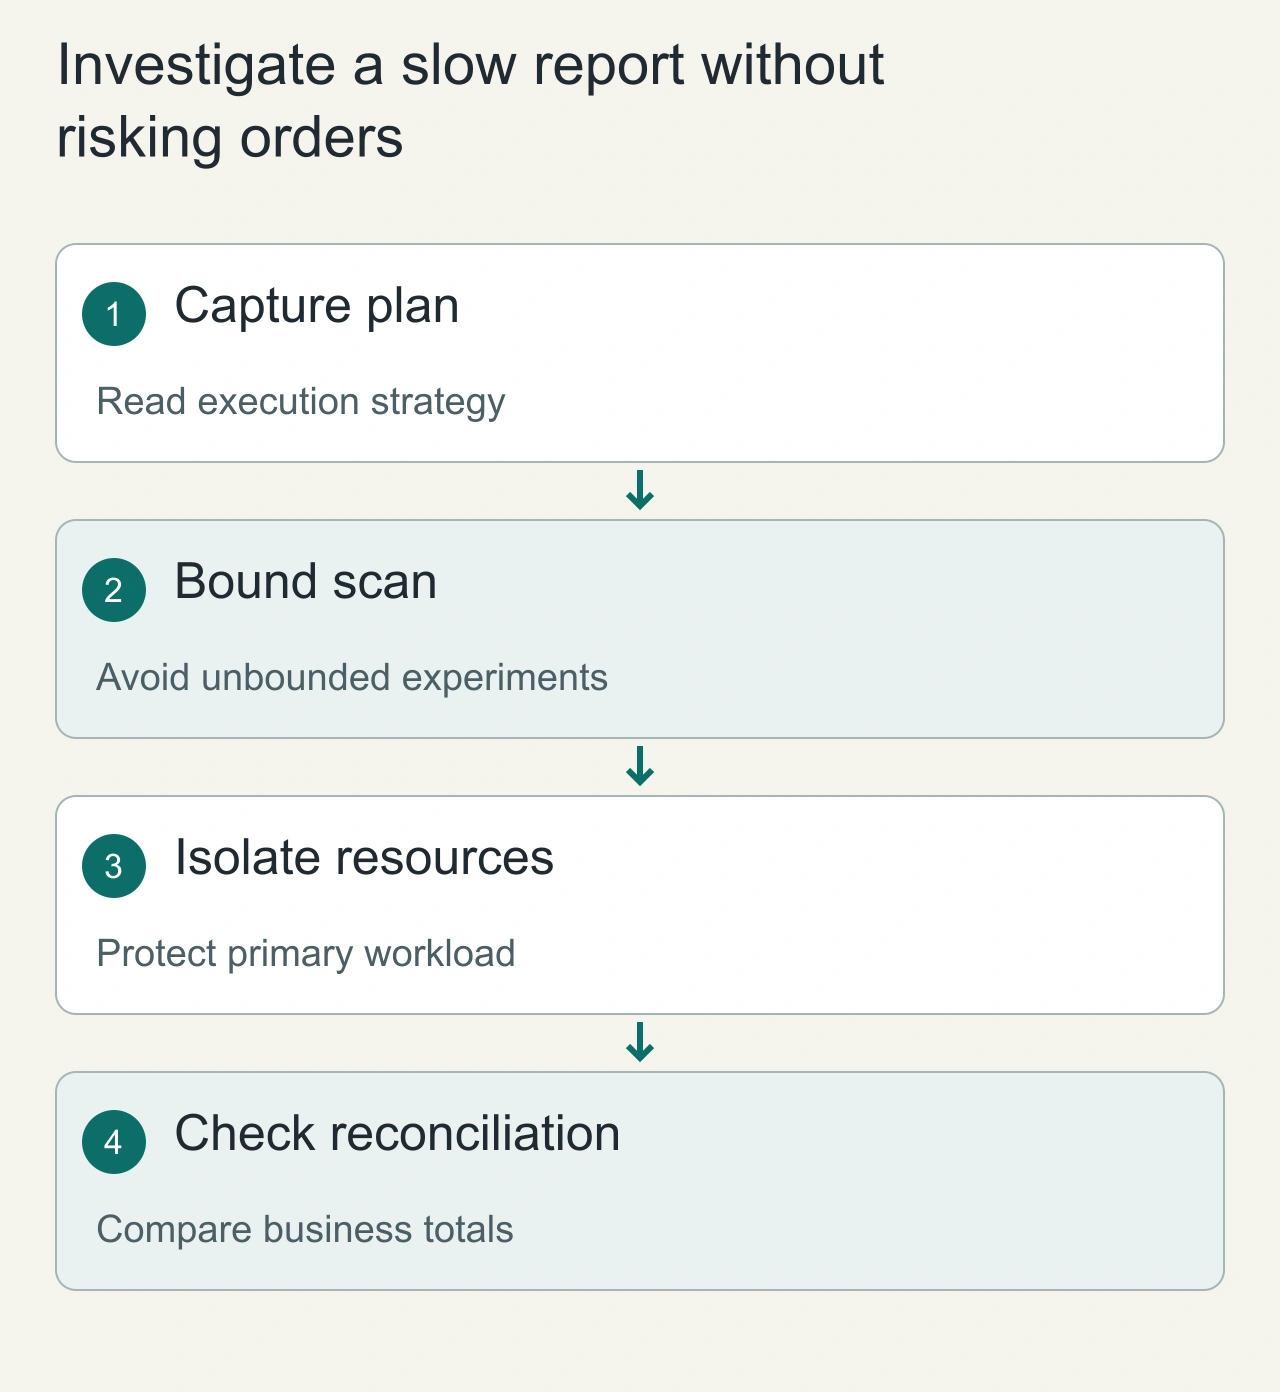
A report investigation should begin with query shape, scanned rows, intermediate sorts and the period being analyzed. On a live primary, an execution tool that actually runs a large statement can consume the same resources as the original problem. Use a safe environment or tightly bounded sample when exploring unfamiliar queries. Compare plans before and after an index or rewrite, and record whether the change improves the intended report without increasing write overhead beyond the operating budget.
For a separated analytical pipeline, verify both speed and agreement with authoritative business totals. A fast chart with missing late events is a data-quality problem, not a performance win. Reconcile a small known period at row level, then compare aggregate counts and amounts. Investigate discrepancies by stable order or event identity rather than by vague percentages alone. Operational alerts should distinguish checkout latency, replica lag and analytics freshness. These signals make it possible to tell whether customers are affected, reports are stale, or a transformation is producing the wrong answer while the infrastructure remains healthy.